As the prices of the Raydium (RAY) and PYTH tokens get closer to important benchmarks, they both exhibit encouraging indications of increasing momentum.
Moreover, PYTH’s price is up by 9.10%, while RAY’s price has seen a 6.79% pump over the past day. Analysts are offering their opinions on whether the bullish trends will persist or encounter resistance as these cryptocurrencies approach possible breakout zones.
Read Also: Why Is BOOK OF MEME (BOME) Price Going Up Today?
What you'll learn 👉
Raydium (RAY) Shows Bullish Momentum Post-Breakout
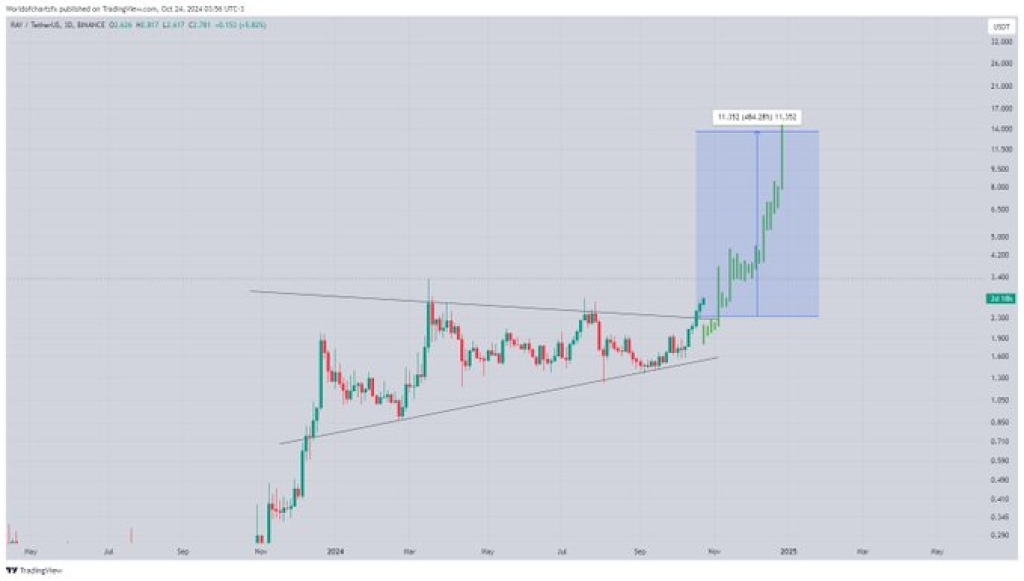
Raydium’s (RAY) recent price action has been marked by a clear breakout from a symmetrical triangle pattern. Before this movement, RAY had consolidated within the triangle, testing support and resistance levels multiple times.
The breakout was accompanied by a notable increase in trading volume, which indicates strong buying interest. World of Charts mentioned RAY’s price has gained almost 20% since this breakout, and the analyst noted that there is still potential for further gains.

The breakout led to the previous resistance line transforming into a support zone around the $2.20-$2.30 range. Traders might consider monitoring this area, as a successful retest of this support could affirm bullish sentiment. With this momentum, RAY could aim for higher targets as long as volume sustains and support holds.
Doge2014 raises 500K in days celebrating Dogecoin. Make potentially big profits and get in on exclusive airdrop!
Show more +PYTH Price Faces Resistance as It Attempts to Breakout
Pyth Network (PYTH) experienced a 9.10% price increase, bringing it close to critical resistance levels. However, the asset has yet to confirm a breakout, remaining below key diagonal resistances and exponential moving averages (EMAs).
Top analyst Waleed Ahmad shared that PYTH’s price has been ‘knocking on the door’ of resistance but has not yet secured a breakthrough. He noted the importance of certain EMAs and the 0.5 diagonal Fibonacci level as barriers that PYTH’s price must overcome for a sustained upward trend.
The chart analysis shows that PYTH has been consolidating after a prolonged decline earlier this year. The current support zone has prevented further downside, acting as a solid base for potential bullish movements. However, a confirmed breakout above these resistance zones is essential to signal the start of a new bullish phase.
Read Also: Celestia Price Prediction: TIA Rally to $7.50 Could Lead Further to $12 Target
Key Technical Levels to Watch
For Raydium (RAY), the breakout has already set a new trading range, with the previous upper trendline now acting as support. Traders will likely watch for continued buying interest around this level. Indicators suggest that a continuation of the uptrend could push RAY toward its projected target zone.
In contrast, PYTH remains in a critical position, near converging resistance points, including diagonal lines, EMAs, and Fibonacci retracement levels. A clear break and close above these would indicate a potential reversal from the consolidation phase, making PYTH a candidate for a bullish breakout.
Read Also: POPCAT Flips BONK on Solana: Where’s the Memecoin Price Headed?
Subscribe to our YouTube channel for daily crypto updates, market insights, and expert analysis.
We recommend eToro
Wide range of assets: cryptocurrencies alongside other investment products such as stocks and ETFs.
Copy trading: allows users to copy the trades of leading traders, for free.
User-friendly: eToro’s web-based platform and mobile app are user-friendly and easy to navigate.


