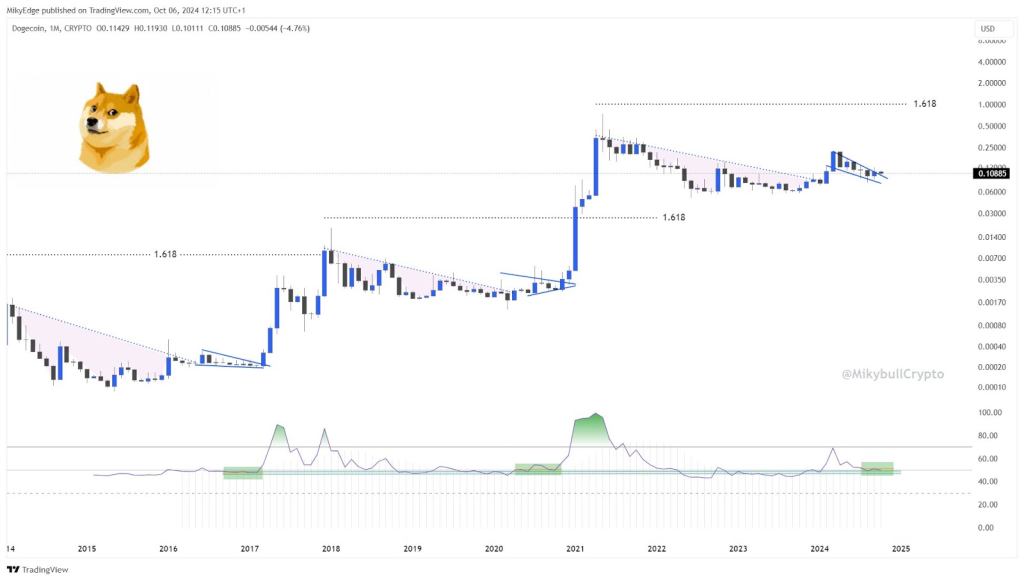
In a recent analysis, MikybullCrypto updated his followers on X (formerly Twitter) that the DOGE price is in a consolidation phase, forming a pattern often linked to bullish price reversals.
The analyst mentioned that Dogecoin’s current price action could signal a new wave of rallies, potentially driving the price to $1, a target widely anticipated in the next market cycle.
What you'll learn 👉
Dogecoin Price Movements and Key Trends
Numerous noteworthy trends are visible in the DOGE price chart. The meteoric climb in 2021, when Dogecoin shot from a penny to nearly $0.75, was one of them.
The price then declined after making such a sharp increase, leveling down between $0.10 and $0.11 where it is now. With the asset maintaining above crucial support levels around $0.108, the current price movement is indicative of a consolidation phase.
Mikkybull’s DOGE chart reveals that the token is forming a falling wedge pattern, a structure often associated with a bullish reversal. Historically, this pattern has resulted in significant price breakouts, with similar movements seen in Dogecoin’s price before its rally in 2017.
Read Also: Where Is The Bitcoin Price Headed Next? Analyst Predicts $68k per BTC ‘Next Week’
Dogecoin Chart Analysis: Falling Wedge and Fibonacci Levels
The DOGE chart displays two falling wedges, one preceding the 2017 rally and another forming after the 2021 retracement. Falling wedges are typically seen as signals of potential bullish breakouts. The current consolidation within the wedge suggests that the Dogecoin price might be setting up for its next major price move.

Fibonacci extension levels offer additional insight. A key Fibonacci level at 1.618 aligns with the potential target of $1, lending support to the prediction made by MikybullCrypto. These levels are often used by traders to project future price movements after a breakout. This alignment with the $1 mark indicates strong technical support for this prediction.
Doge2014 raises 500K in days celebrating Dogecoin. Make potentially big profits and get in on exclusive airdrop!
Show more +Support and Resistance Zones
Dogecoin’s price action around $0.108 has established this area as a significant support zone. Buyers appear to be defending this level, preventing further declines. The resistance level is marked by the upper trendline of the falling wedge, which Dogecoin will need to break through to confirm a bullish trend.
Once the price breaches this resistance, it could trigger a new wave of upward momentum. Historical data shows that similar breakouts over the past have led to sharp price increases, making this resistance level a critical point to watch for traders.
Furthermore, Dogecoin’s current consolidation phase may be the calm before the next storm. If the breakout from the falling wedge pattern follows historical trends, the $1 target could become a reality in the coming months.
This neutral analysis provides an objective view of Dogecoin’s potential based on technical patterns and trader sentiment, presenting a factual outlook without speculating on timelines. Investors will be watching closely as DOGE approaches critical price levels.
Subscribe to our YouTube channel for daily crypto updates, market insights, and expert analysis.
We recommend eToro
Wide range of assets: cryptocurrencies alongside other investment products such as stocks and ETFs.
Copy trading: allows users to copy the trades of leading traders, for free.
User-friendly: eToro’s web-based platform and mobile app are user-friendly and easy to navigate.


