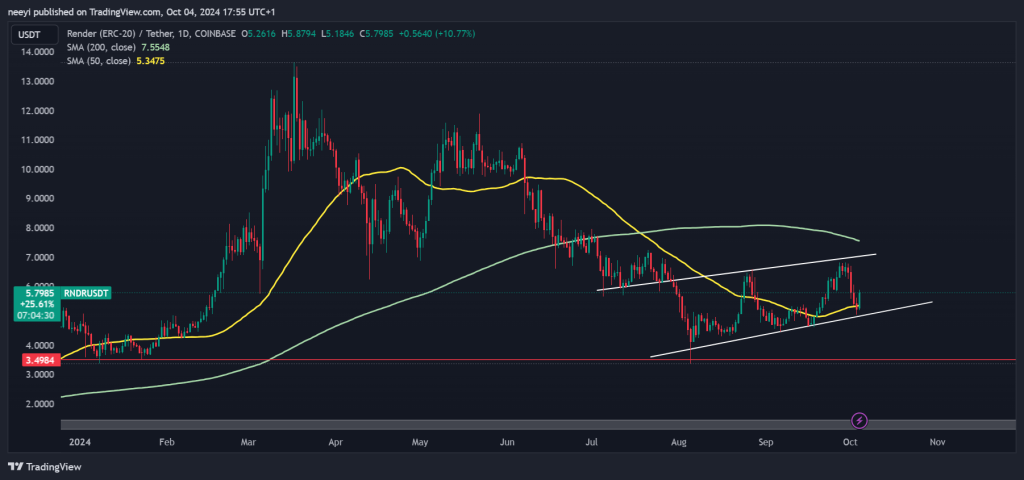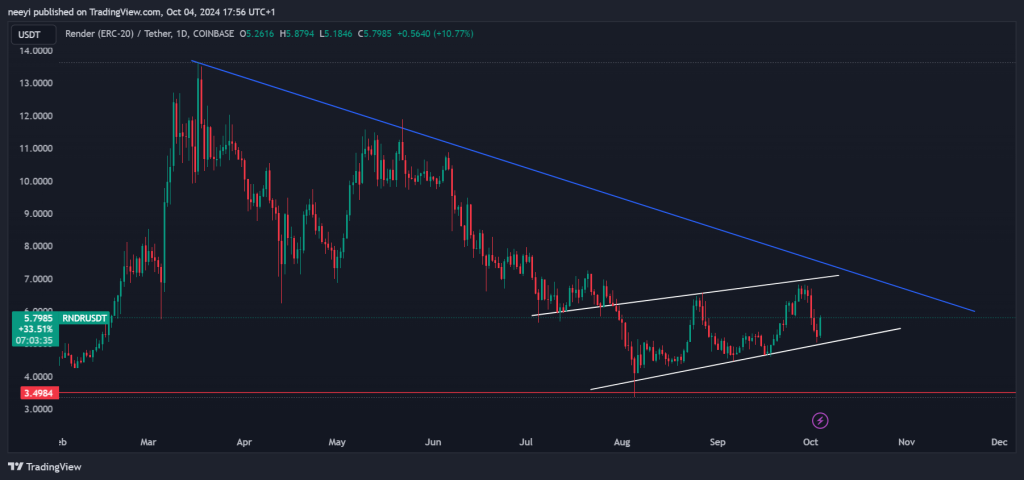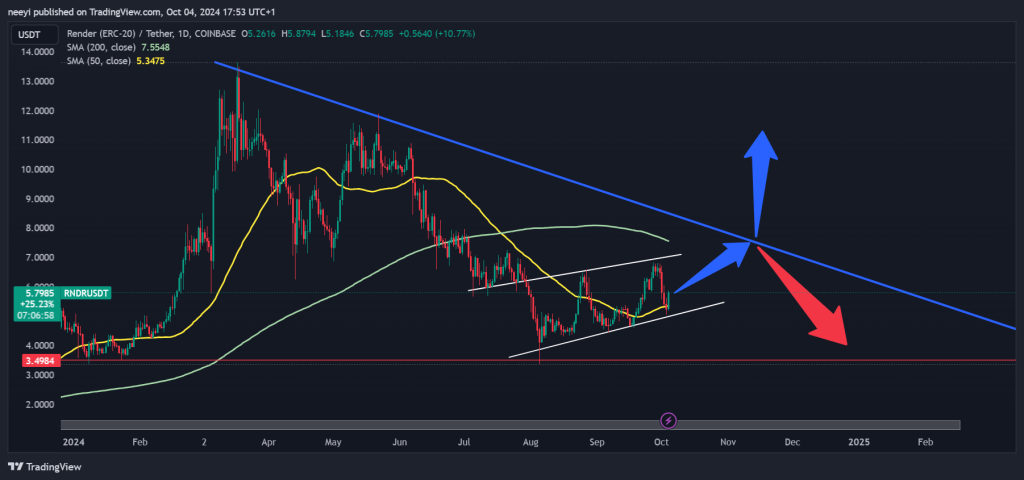
The price of Render (RNDR) is currently showing a mixed picture as it trades within a small ascending channel, with the top of the channel acting as resistance and the base providing support since the beginning of August.
A closer look at the chart shows that Render’s price action has formed a double top, with the first top occurring around March and the second in May. This triggered a downward slope as expected until it reached resistance at around $3.5642.

Since then, the price has been moving up steadily, albeit slowly. The only support holding the price right now is the base of the ascending channel; if this support fails, we could see a price drop of around 40% from its current level.
What you'll learn 👉
Potential Breakout Scenarios
On the other hand, if the price manages to break above the resistance at the top of the channel, we could see a rally back towards the last top. However, this seems unlikely, considering that the double-top pattern resembles the beginning of a descending channel.

Therefore, we could expect the price to reach the blue trendline resistance and continue with a downward slope. Overall, Render’s chart does not look very attractive right now, and speculative traders would need to be more strategic in planning their trades.
Technical Indicators Show Mixed Pictures
The relative strength index is at 52, which is neutral, indicating that the price has a lot of room to move, whether bullish or bearish.
The 50-day simple moving average (SMA) is currently serving as support for the price, reinforcing the idea of a potential upward movement in the short term. In contrast, the 200-day simple moving average could act as resistance against further price growth in the medium term.
Doge2014 raises 500K in days celebrating Dogecoin. Make potentially big profits and get in on exclusive airdrop!
Show more +
Summary and Outlook
In summary, Render appears to be strongly bearish, but it is currently going through a corrective phase. We might see a 20% rally to the top of the micro bullish channel, and if that breaks out, we could see a move to the blue bearish trendline resistance.
From there, the price could face a major rejection and continue its bearish trend. However, a breakout from the blue trendline could signal the beginning of a significant rally.
Subscribe to our YouTube channel for daily crypto updates, market insights, and expert analysis.
We recommend eToro
Wide range of assets: cryptocurrencies alongside other investment products such as stocks and ETFs.
Copy trading: allows users to copy the trades of leading traders, for free.
User-friendly: eToro’s web-based platform and mobile app are user-friendly and easy to navigate.


