
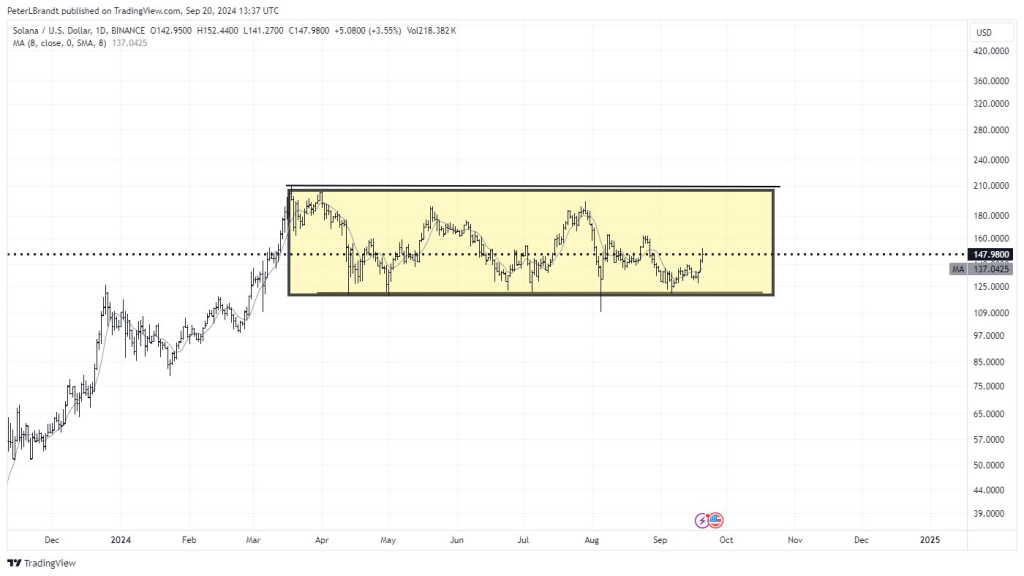
Peter Brandt, with more than 730,000 followers on X, posted a technical analysis of Solana (SOL) using the daily timeframe. The analyst posted a potential rectangular trading pattern between key price levels.
The highlighted rectangular box ranges approximately from $120 (support level) to around $210 (resistance level).
SOL has been oscillating between the defined support and resistance levels since April. The chart shows multiple touches near both the $120 and $210 levels, reinforcing the validity of these levels.
Doge2014 raises 500K in days celebrating Dogecoin. Make potentially big profits and get in on exclusive airdrop!
Show more +The chart indicates that $120 has held as a crucial support multiple times, with price bouncing off this level. Peter Brandt suggests that this repeated defense could fuel a sizable advance, given it’s a solid floor where buyers consistently step in.
Similarly, the resistance level near $210 has been tested several times, with SOL failing to break above it. A breakout beyond this level could confirm the bullish potential of the pattern, as rectangles often precede major price advances when the upper boundary is breached.
What you'll learn 👉
Short-Term Rally Possibilities Are Clear
The chart includes an 8-day moving average currently around $137, indicating that the price is above this trend indicator, which typically signals short-term bullish momentum.
Now that the price has bounced bottom of the rectangle, we may see a spike toward the top at around 210 in the short- and medium-term.
An Eventual Breakout from the Rectangle Could Trigger a Spike to $300 or Beyond
Rectangles are typically continuation patterns, meaning the price could continue the upward trajectory once the range is broken to the upside. The previous trend before the formation of this rectangle was bullish, so the chances of a bullish breakout could be higher.
If the price breaks out of this rectangular range, the measured move target (the height of the rectangle added to the breakout point) could project a potential move toward $300 or beyond. This projection is based on the height of the range (approximately $90 difference between $120 and $210).
Subscribe to our YouTube channel for daily crypto updates, market insights, and expert analysis.

We recommend eToro
Wide range of assets: cryptocurrencies alongside other investment products such as stocks and ETFs.
Copy trading: allows users to copy the trades of leading traders, for free.
User-friendly: eToro’s web-based platform and mobile app are user-friendly and easy to navigate.