Fantom’s (FTM) token has seen a modest increase in value over the last 24 hours, despite how bloody the crypto market is.
CoinMarketCap statistics showed that FTM’s price dropped to $0.3951 yesterday before rising to $0.48. The tokens’s price saw an 13% price gain on the last day, and the trading volume increased by 59.09%.
Moreover, an extended period of consolidation accompanied this breakout, which contributed to the increase in FTM’s value.
What you'll learn 👉
Support and Resistance Levels Driving FTM Price
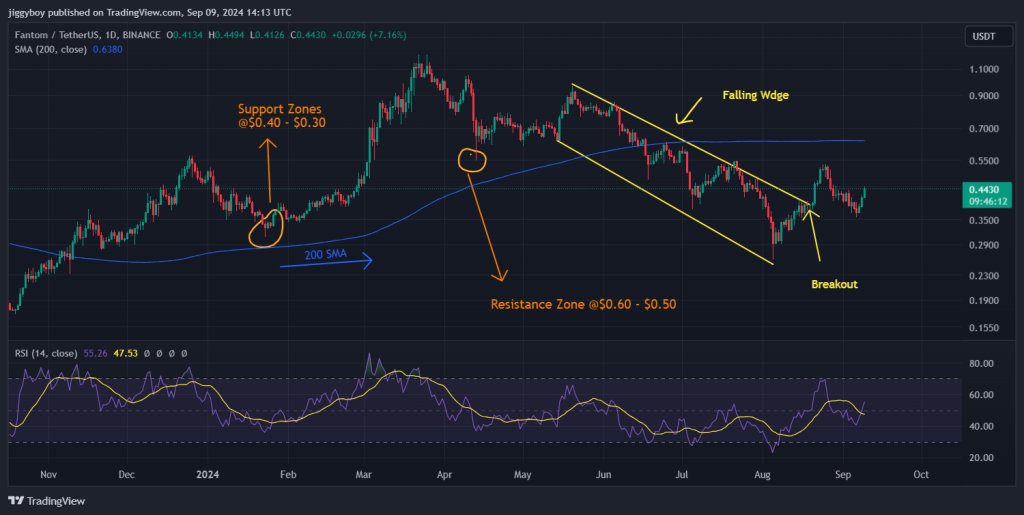
The Fantom price chart reflects critical support and resistance zones that have guided its movement.
The token’s price currently finds support between $0.30 and $0.40 but continues to face resistance between $0.50 and $0.60, where the price often retreats after getting close to this level.
Moreover, if the price breaks this resistance or retreats toward support, it will be essential for understanding the future direction of FTM.
Doge2014 raises 500K in days celebrating Dogecoin. Make potentially big profits and get in on exclusive airdrop!
Show more +200-Day SMA Indicates Long-Term Trend
The 200-day Simple Moving Average (SMA), currently trending around $0.6380, plays a critical role in defining the long-term trend for Fantom.
A price below this moving average suggests that the asset remains in a bearish phase. The SMA also acts as a dynamic resistance level, making it an important target for bulls to overcome.

Despite the overall bearish sentiment, the recent price breakout could be an early indicator of a potential reversal. If FTM continues to gain momentum, the next objective will be to push above the 200-day SMA, further signaling bullish strength.
Falling Wedge Breakout Triggers Bullish Sentiment
One pivotal change is that the price of FTM broke out of the pattern it was in. After weeks of the price staying within this pattern, it has now broken above the upper line, which suggests the momentum is shifting.
Since the breakout, the price has been staying around $0.4430. This suggests that the market is gathering strength, preparing for a potential move to higher price levels.
Read Also: Crypto Prices Are Down, But $SUI, $TON, $APT and Other Networks See On-Chain Growth
RSI Shows Neutral but Upward Momentum
The Relative Strength Index (RSI) for Fantom stands at around 47.53, which indicates the market conditions are neutral.
However, the RSI has been slowly going up, which suggests the momentum is building. This aligns with the breakout seen in the price chart, further supporting the case for a potential upward continuation.
Finally, the recent price action and indicators suggest the price of FTM may continue going up shortly. Investors will be monitoring this indicator closely as it approaches key levels that could trigger further price action.
Subscribe to our YouTube channel for daily crypto updates, market insights, and expert analysis.
We recommend eToro
Wide range of assets: cryptocurrencies alongside other investment products such as stocks and ETFs.
Copy trading: allows users to copy the trades of leading traders, for free.
User-friendly: eToro’s web-based platform and mobile app are user-friendly and easy to navigate.


