Dogecoin’s $DOGE spent most of August in a narrow $0.10 channel, but in the last week, a breakout was attempted, and it rose by 8.5% to a $0.114 peak.
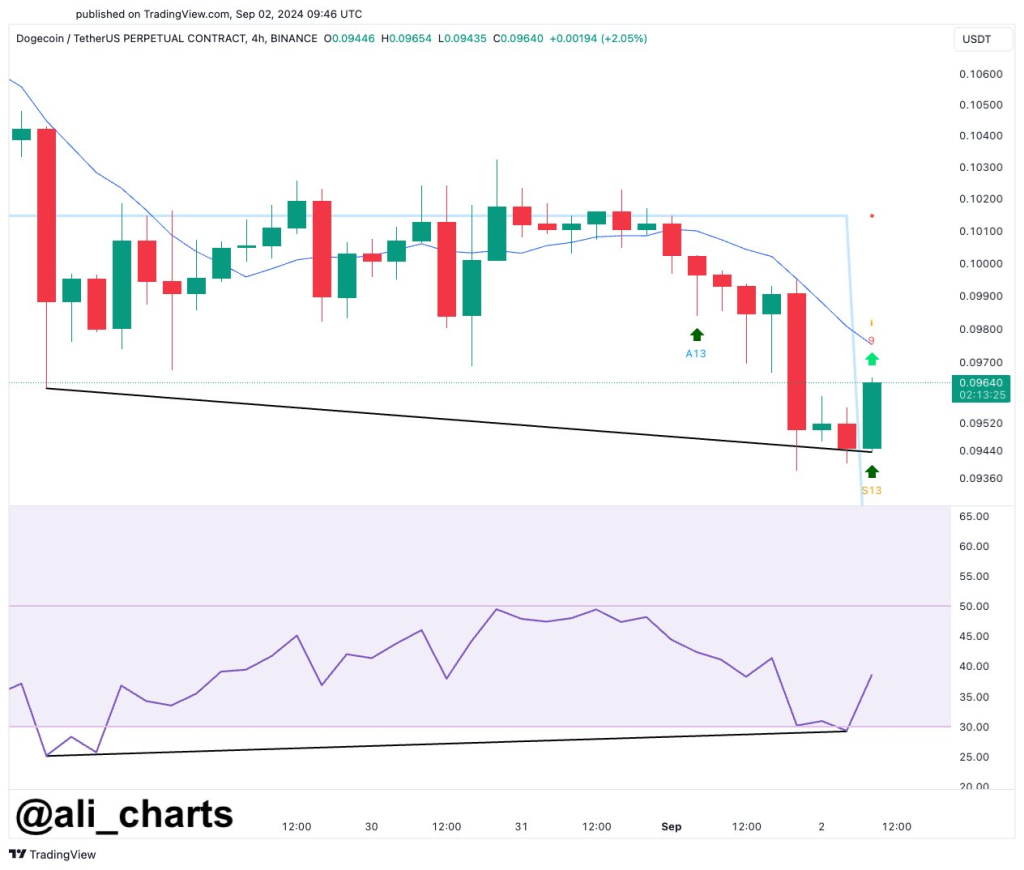
Yesterday, Twitter analyst Ali Charts told and shared a chart with his 70k followers that Dogecoin’s price shows a bullish divergence against the Relative Strength Indicator (RSI) on the 4-hour chart, and the Tom Denmark (TD) Sequential indicates that a price rebound is on the horizon after its downward trend display.
What you'll learn 👉
Dogecoin Chart: Technical Analysis
The bullish divergence between Dogecoin’s price and its RSI is one of the interesting patterns observed on the chart posted by the analyst.
With the RSI at 40, Dogecoin is in bearish territory and is starting to recover. This occurred because the price has formed lower lows and the RSI indicator has formed higher lows in this 4-hour chart.
However, the RSI has bounced off the oversold region, which hints at the potential for upward momentum.

Ali Charts spoke on the TD sequential; this appeared because of a series of nine consecutive candles closing lower. The indicator flashed an S13, hinting at a buy signal.
This, however, indicates that the current downward trend might be rounding off and could lead to an upward movement in the price of Doge.
Support and Resistance Levels
A support level of $0.094 around the descending trendline was identified. Doge, however, recently tested this support level, and the strong green candlestick in the chart shows that the price has recently bounced off this support level.
Furthermore, the resistance zone can be seen above the current price, near the $0.098 to $0.100
Read also: Massive Accumulation of This Meme Coin During the Dip – Hint: Not PEPE
Where Is The DOGE Price Headed Next?
Dogecoin could be eyeing a comeback because of the bullish RSI divergence and the TD sequential buy signal. Keeping an eye on the resistance level around $0.098 is important.
A break above this level with increased volume could propel the price toward the psychological level of $0.1000 or higher. However, if the price breaks below the $0.0940 support level, it may retest the lower support and result in additional bearish pressure.
This article was written by CaptainAltcoin’s part-time writer Bolu Dan.
Subscribe to our YouTube channel for daily crypto updates, market insights, and expert analysis.
We recommend eToro
Wide range of assets: cryptocurrencies alongside other investment products such as stocks and ETFs.
Copy trading: allows users to copy the trades of leading traders, for free.
User-friendly: eToro’s web-based platform and mobile app are user-friendly and easy to navigate.


