We’ve grown accustomed to Kaspa’s bullish momentum over the past year, so when it’s not moving upward, traders naturally become unsettled.
In the last 30 days, the KAS price has actually increased by 4% and is now trading slightly below $0.17. However, this modest gain doesn’t tell the whole story.
Alan Santana, who is one of the elite crypto traders, posted a Kaspa price analysis yesterday where he warned of a possible 49% price crash.
What you'll learn 👉
Kaspa Chart Breakdown
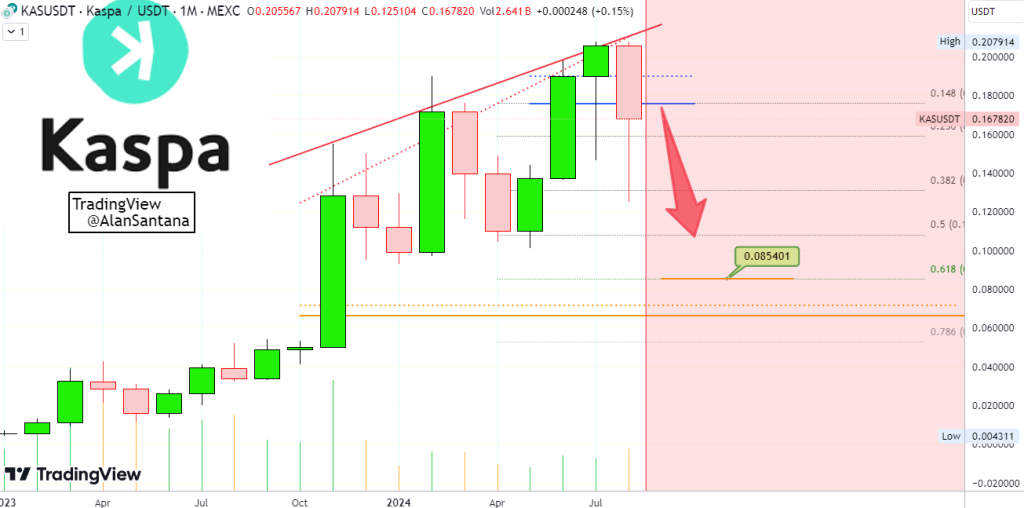
Santana’s chart paints a pretty grim picture for Kaspa’s short-term prospects. He noted “Here we have the long-term chart for Kaspa. This is the worst month so far.”
At the top of the chart, there’s this red line that’s been giving KAS a hard time. It’s like a ceiling that the price keeps bumping its head against. Every time KAS tries to break through, it gets knocked back down.
But that’s not the only bad news. You see those blue lines on the chart? Those were supposed to be our safety nets, the levels where buyers typically step in to catch a falling knife. Well, KAS has blown right through them. It’s like watching a high-wire act where someone just cut the safety rope.

Now, let’s talk about those candles. July’s candle closed as what traders call a “hammer.” Normally, that might sound good, right? Like, “hammer time” for the bulls? Not so fast. When you see a hammer after a long uptrend, it’s often a sign that the party might be over. And August isn’t looking any better. That red candle we’re seeing is like a big “EXIT” sign flashing over the bull market.
The volume in August is through the roof – we haven’t seen action like this since last December. High volume on a bearish candle is like hearing thunder after seeing lightning. It’s a sign that a storm is coming, and in this case, the storm might be a flood of sellers.
Read also: This Kaspa Rival Is a $Billion Crypto In the Making – Here’s Why
Fibonacci Retracement and Price Targets
Santana didn’t stop there. He pulled out the big guns with something called Fibonacci retracement levels. Don’t worry if that sounds like a fancy pasta dish – it’s just a tool traders use to guess where prices might go next.
According to Santana, KAS likes to take breathers around the 0.618 and 0.786 Fibonacci levels. That 0.618 level is sitting pretty at about $0.085. Now, I know what you’re thinking – that’s a long way down from our current $0.1678. You’re not wrong. We’re talking about a potential nosedive of almost 50%.
Doge2014 raises 500K in days celebrating Dogecoin. Make potentially big profits and get in on exclusive airdrop!
Show more +But here’s the kicker – Santana thinks it could go even lower. Smaller crypto projects like KAS can be as unpredictable as a cat in a room full of rocking chairs, so we might see even deeper cuts.
Now, before you go selling your KAS for magic beans, Santana throws us a lifeline. He thinks that after this stomach-churning drop, we might see a bull market that’ll make your head spin. So if you’ve got the stomach for it, this might be like Black Friday for KAS – everything must go, but the sales won’t last forever.
Subscribe to our YouTube channel for daily crypto updates, market insights, and expert analysis.
We recommend eToro
Wide range of assets: cryptocurrencies alongside other investment products such as stocks and ETFs.
Copy trading: allows users to copy the trades of leading traders, for free.
User-friendly: eToro’s web-based platform and mobile app are user-friendly and easy to navigate.


