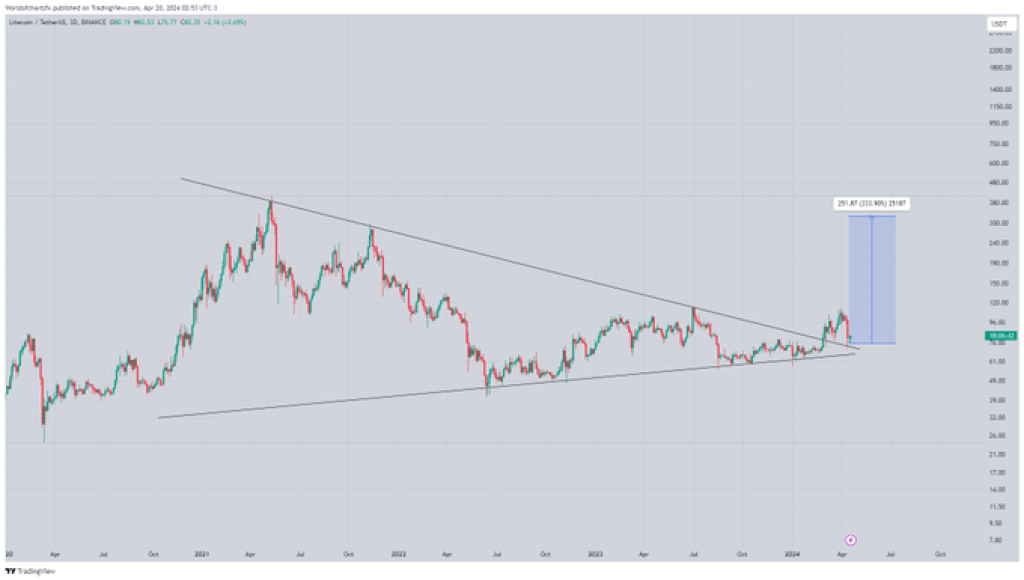
World Of Charts, a top crypto analyst, shared a compelling price chart analysis for Litecoin (LTC), highlighting the cryptocurrency’s potential for a significant bullish wave. According to the analysis, Litecoin has successfully broken out from a multi-year symmetrical triangle pattern, indicating a possible 300-400% price surge in the mid-term.
What you'll learn 👉
LTC’S Technical Analysis
The analysis begins by identifying two crucial trendlines on the chart. The first is a descending trendline, connecting the lower highs, which has acted as resistance, preventing the price from breaking through. Conversely, the second trendline is ascending, connecting the higher lows, indicating support levels where buyers have stepped in to halt the price decline.

Initially, the chart displays a substantial upward movement, signaling a bullish period. However, this bullishness appears to have ended around the start of the descending trendline. From there, the price has experienced a series of lower highs and higher lows, forming a converging pattern known as a symmetrical triangle.
A symmetrical triangle is typically a continuation pattern, meaning that the breakout often occurs in the direction of the trend preceding the triangle formation. Significantly, the chart shows a breakout to the upside, with the price moving sharply above the descending trendline, potentially signaling a reversal of the previous downtrend.
The analysis further suggests a highly optimistic price target, represented by a blue rectangle. This target is calculated by taking the height of the back of the triangle and projecting that same distance from the point of the breakout. Consequently, the chart indicates a potential 333.30% increase from the breakout point, highlighting the massive bullish wave that Litecoin could experience.
Doge2014 raises 500K in days celebrating Dogecoin. Make potentially big profits and get in on exclusive airdrop!
Show more +Litecoin’s Price Performance
According to the latest price data from CoinMarketCap, Litecoin’s price currently stands at $82.65, with a 24-hour trading volume of $388,538,071. Notably, Litecoin has witnessed a 1.31% increase in the last 24 hours, further reinforcing the bullish sentiment surrounding the cryptocurrency.
Hence, the observed upward movement beyond a symmetrical triangle in Litecoin’s trading pattern might mark an important shift, suggesting the emergence of a bullish trend. This analysis pinpoints the breakout as a noteworthy event which could indicate the beginning of a significant uptrend.
Hunting for a small cap coin that could explode 10x? We’ve unveiled a few last week alone.
Get all our future calls by joining our FREE Telegram community.
We recommend eToro
Wide range of assets: cryptocurrencies alongside other investment products such as stocks and ETFs.
Copy trading: allows users to copy the trades of leading traders, for free.
User-friendly: eToro’s web-based platform and mobile app are user-friendly and easy to navigate.


