Dogecoin (DOGE), the popular meme-inspired cryptocurrency, has recently shown impressive price action, confirming a new macro uptrend and breaking out of a bull flag pattern. According to renowned analyst Rekt Capital, these developments position Dogecoin for further upside continuation.
What you'll learn 👉
Retesting the Macro Downtrend and Breakout Rally
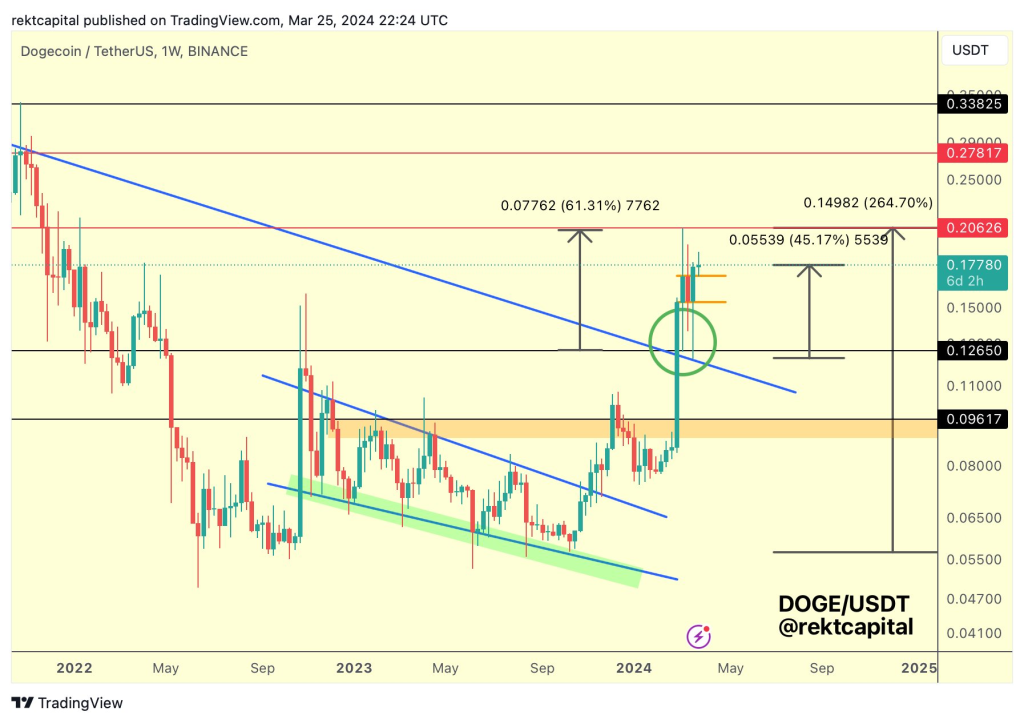
Rekt Capital highlights that Dogecoin has successfully retested the macro downtrend, which preceded a remarkable 45% breakout rally to the upside. This retest not only confirms the establishment of a new macro uptrend but also sets the stage for potential future gains.
Furthermore, Dogecoin’s breakout from the bull flag pattern indicates that the cryptocurrency is well-positioned for trend continuation. Bull flags are considered one of the most reliable continuation patterns among traders, as they often indicate a brief consolidation period before the previous trend resumes.

Weekly Candle Closes Above Bull Flag Top
In an earlier tweet, Rekt Capital noted that Dogecoin’s weekly candle closed above the bull flag top, a significant bullish signal. Moreover, DOGE has already retested the bull flag top as new support this week, further validating the breakout.
These technical developments indicate that Dogecoin has taken all the necessary steps to confirm the breakout from the bull flag pattern and position itself for continued upside momentum.
Technical Analysis by altFINS
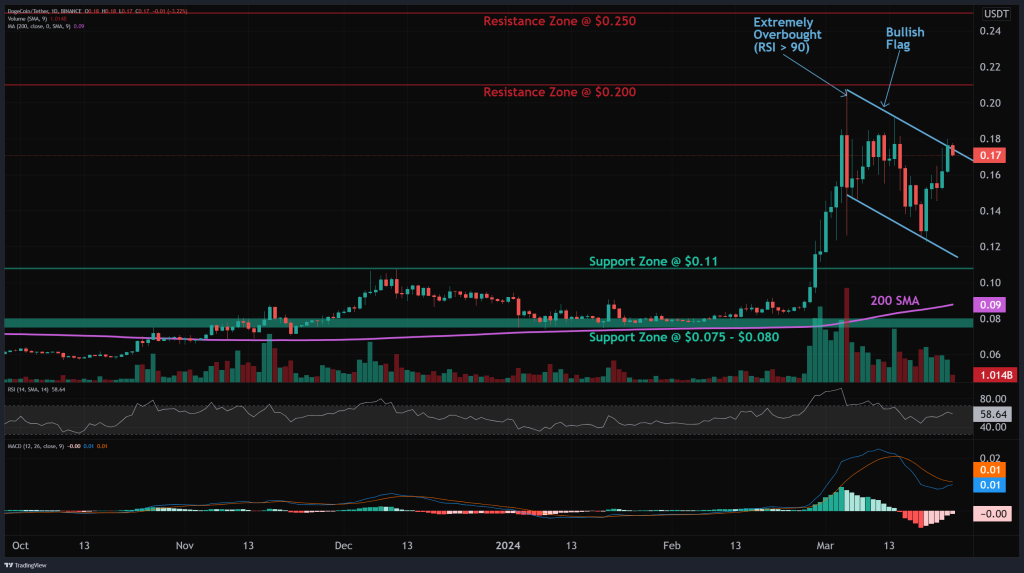
According to altFINS, a leading technical analysis platform, Dogecoin’s near-term outlook is neutral, with the cryptocurrency currently forming an emerging bullish flag pattern. The platform notes that DOGE is in an uptrend, having spiked up to the $0.20 resistance level for a 150% gain. However, the price became extremely overbought, with the Relative Strength Index (RSI) reaching around 90, leading to a rejection.
For trend traders, altFINS recommends waiting for a breakout, most likely a bullish one, in the direction of the existing uptrend. Once the breakout occurs, the price could revisit $0.20 or higher.

Source: altFINS – Start using it today
Swing traders, on the other hand, can trade between the pattern trendlines, buying near the support trendline (around $0.11) and selling near the resistance trendline (approximately $0.15).
Momentum and Support/Resistance Levels
Dogecoin’s momentum is currently mixed, with the MACD line below the MACD signal line (bearish) but the RSI above 55 (bullish). However, the rising MACD histogram bars suggest that momentum could be nearing another upswing.
The nearest support zone for DOGE is $0.110, followed by the $0.075-$0.080 range. On the upside, the nearest resistance zone is $0.200, followed by $0.250.
Dogecoin’s recent price action, characterized by the confirmation of a new macro uptrend and a breakout from the bull flag pattern, paints a bullish picture for the meme-inspired cryptocurrency. As DOGE continues to navigate the volatile crypto market, traders and investors will be closely monitoring its performance for further signs of upside continuation.
You may also be interested in:
- Bitcoin’s Bearish Signals Suggest Potential for Prolonged Correction: Analyst Cautions That BTC is Set to Move Lower
- Internet Computer (ICP) And Chromia (CHR) Prices Pumping: Here’s Why
- Why Meme Coins Like Floki Inu and Dogecoin Should Be Worried About Leading Crypto Presale Scorpion Casino
We recommend eToro
Wide range of assets: cryptocurrencies alongside other investment products such as stocks and ETFs.
Copy trading: allows users to copy the trades of leading traders, for free.
User-friendly: eToro’s web-based platform and mobile app are user-friendly and easy to navigate.


