A trader known as CaptainCrypto was closely monitoring the movements of Litecoin (LTC). With a keen eye and a deep understanding of technical analysis, he noticed a promising pattern emerging.
“Litecoin is breaking out, target: $110. Then we sell. Just kidding!!!!!!! We don’t sell till $1000+ Let’s go $LTC!” CaptainCrypto proclaimed, his excitement palpable in the digital realm.
His analysis was backed by the expert insights of altFINS, a renowned cryptocurrency analysis firm. According to their report, the trade setup for Litecoin was looking bullish across all timeframes – short, medium, and long-term.
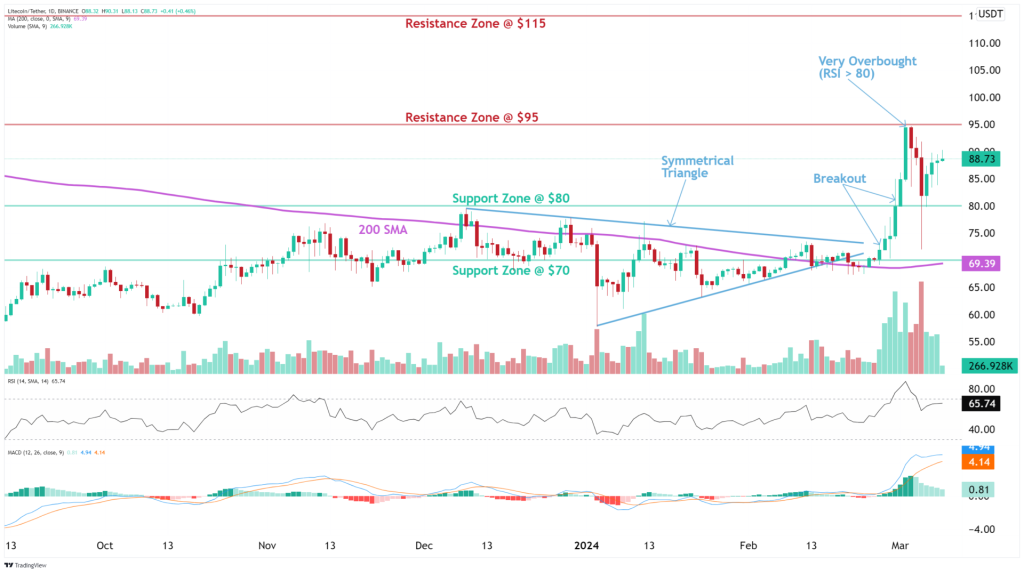
“Price is in an Uptrend,” altFINS explained. “Following a bullish breakout from a Symmetrical Triangle, price rallied +40% to our target of $95, where it got overbought (RSI > 80) and pulled back on some profit-taking.”
Doge2014 raises 500K in days celebrating Dogecoin. Make potentially big profits and get in on exclusive airdrop!
Show more +For those unfamiliar with technical analysis, the Relative Strength Index (RSI) is an indicator that measures the magnitude of recent price changes to evaluate overbought or oversold conditions. An RSI value above 80 is considered overbought, signaling a potential pullback or reversal.
altFINS continued, “Pullback near $80 support for another swing trade entry in Uptrend with +19% upside potential back to $95. Stop Loss (SL) at $76. (set a price alert).”
A stop-loss order is a type of trade order that instructs the broker to sell a security when it reaches a certain price, helping to limit potential losses.
Source: altFINS – Start using it today
The altFINS analysis also delved into the momentum and trend indicators. “Momentum is Bullish but inflecting. MACD Line is above MACD Signal Line, and RSI is above 55, but momentum may have peaked since MACD Histogram bars are declining, which suggests that momentum is weakening.”
The Moving Average Convergence Divergence (MACD) is a trend-following momentum indicator that shows the relationship between two moving averages of a security’s price. When the MACD line crosses above the signal line, it signals a bullish trend, but declining histogram bars indicate waning momentum.
Finally, altFINS outlined the key support and resistance levels. “Nearest Support Zone is $80 (previous resistance), then $70. The nearest Resistance Zone is $95, then $115.”
With this comprehensive analysis in hand, CaptainCrypto and fellow traders prepared to ride the Litecoin wave, keeping a watchful eye on the market and adjusting their strategies as needed.
You may also be interested in:
- Fantom (FTM) Sees Significant Uptick in Whale Transactions and Market Sentiment Which Could Continue to Surge Price Higher
- SEI Token on the Verge: Analyst Predicts Surge to This Next Price Level, But There’s a Catch
- BlockDAG Presale In Full Swing Raises Above $3M In Presale Amid Chainlink and TRON Price Surges

We recommend eToro
Wide range of assets: cryptocurrencies alongside other investment products such as stocks and ETFs.
Copy trading: allows users to copy the trades of leading traders, for free.
User-friendly: eToro’s web-based platform and mobile app are user-friendly and easy to navigate.