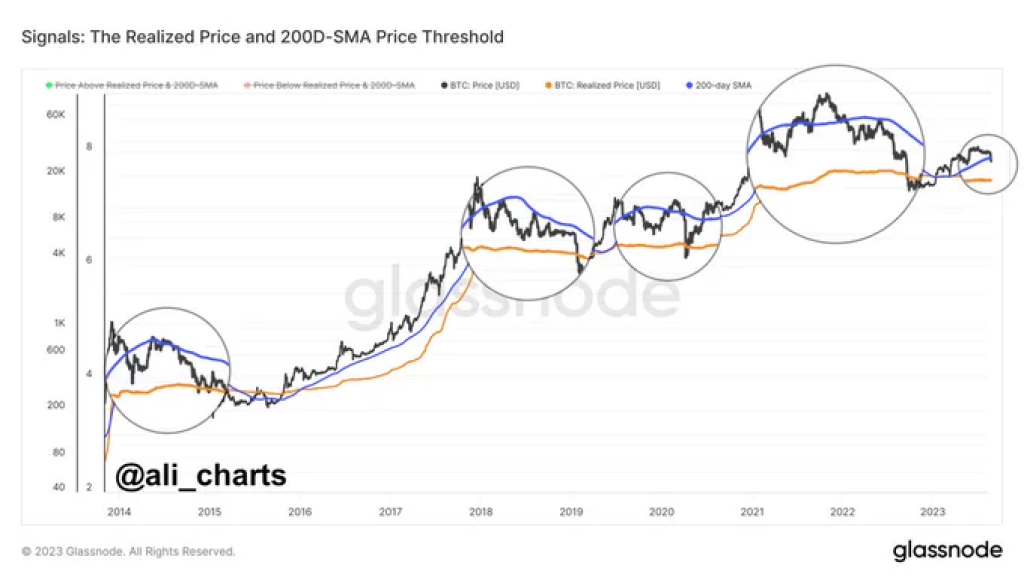
The price of bitcoin has faced significant downward pressure in recent weeks, with the cryptocurrency dropping below its 200-day moving average (MA), according to trader Ali. This key technical indicator has marked previous major corrections in bitcoin’s price history, often preceding drops to the “realized price” – an on-chain metric that currently sits around $20,350.

Ali also pointed to a buy signal on the daily chart after the TD sequential indicator presented a setup, but confirmation of a trend reversal would likely require a sustained close above the 200-day MA. For now, the $25,200 to $24,800 zone is being watched closely as a potential pivotal support zone. Breaching this area could pave the way for a more significant bitcoin price dip toward the $20,000 level.
The weekly chart is also looking increasingly bearish, with the price closing below key exponential moving averages. According to some, if the current technical setup proves to be a bull trap fakeout, bitcoin would need to reclaim key levels quickly to avoid further downside. The fact that a final volatility gauge (FVG) opened near current levels adds weight to the bearish scenario of a wick down to around $20,000 before any substantial bounce materializes.
Historical price cycles also suggest bitcoin’s bear markets are often followed by even larger bull runs. While short-term price action remains uncertain, some still see potential for new highs in the long-term as adoption continues to grow. For now, analysts and traders alike will be closely monitoring price action and key levels around the $20,000 zone.
Bitcoin is currently hovering around $26,000 after dropping from its 30-day high of $30,000.
We recommend eToro
Wide range of assets: cryptocurrencies alongside other investment products such as stocks and ETFs.
Copy trading: allows users to copy the trades of leading traders, for free.
User-friendly: eToro’s web-based platform and mobile app are user-friendly and easy to navigate.


