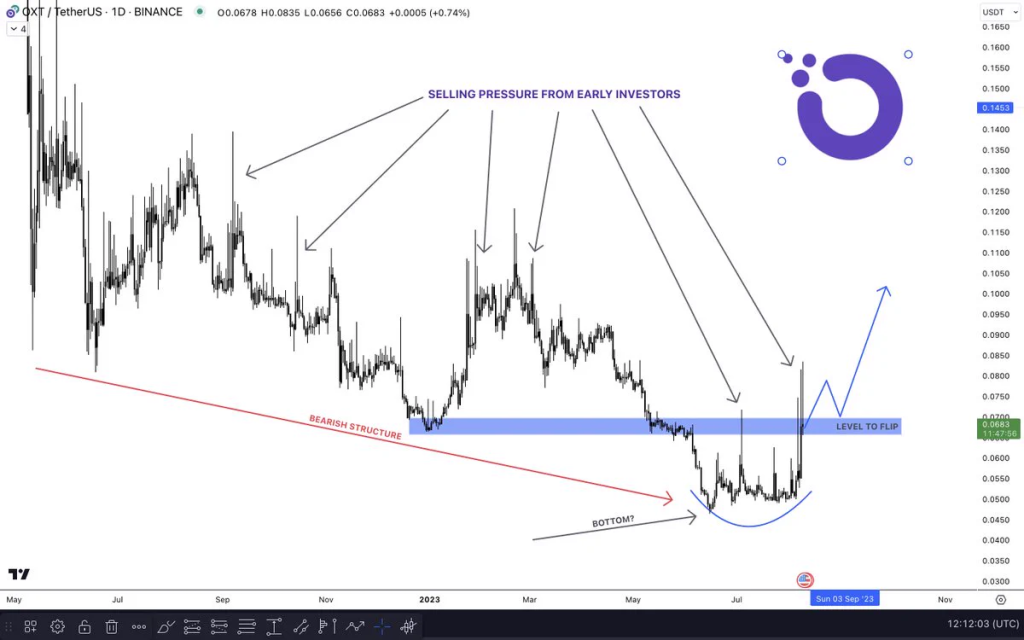
The Orchid Protocol (OXT) token has seen tremendous upside momentum in recent days, surging over 45% in the past week. However, technical indicators suggest the powerful rally may be nearing its conclusion.
OXT peaked at $0.08 on August 9th, reaching its highest level since late May. The rally comes after weeks of range-bound trading between $0.05 and $0.06.
However, topping indicators have emerged that could foreshadow an impending reversal per the analysis by Triangle_boy and Sjuul. The daily Relative Strength Index (RSI) is showing a reading of 71, deep in overbought territory. This suggests the token is overextended after its parabolic move higher.
The significant upper wicks on the daily candlestick chart also demonstrate strong selling pressure at the recent highs. This reveals that bulls are losing momentum as buyers become exhausted after the extended uptrend.
The token may find support near the $0.05 level if a pullback occurs. This prior resistance area that OXT broke out from could flip to become support. The 38.2% Fibonacci retracement level also sits at $0.05, adding to its technical relevance.

However, failure to hold the $0.05 support could lead to a deeper correction. The next key area to watch would be the 50% retracement near $0.045.
Traders should monitor OXT closely in the coming sessions. A confirmed sideways consolidation or bearish reversal pattern would likely signal the top is in place. Those long the token may consider taking profits on remaining positions if weakness continues.
OXT remains entrenched in a long-term downtrend on the higher timeframes. While the recent rally has been impressive, significant obstacles lay ahead before a sustainable new uptrend can take shape. Traders may use any pullbacks as opportunities to take advantage of short-term swings in the sideways chop ahead.


