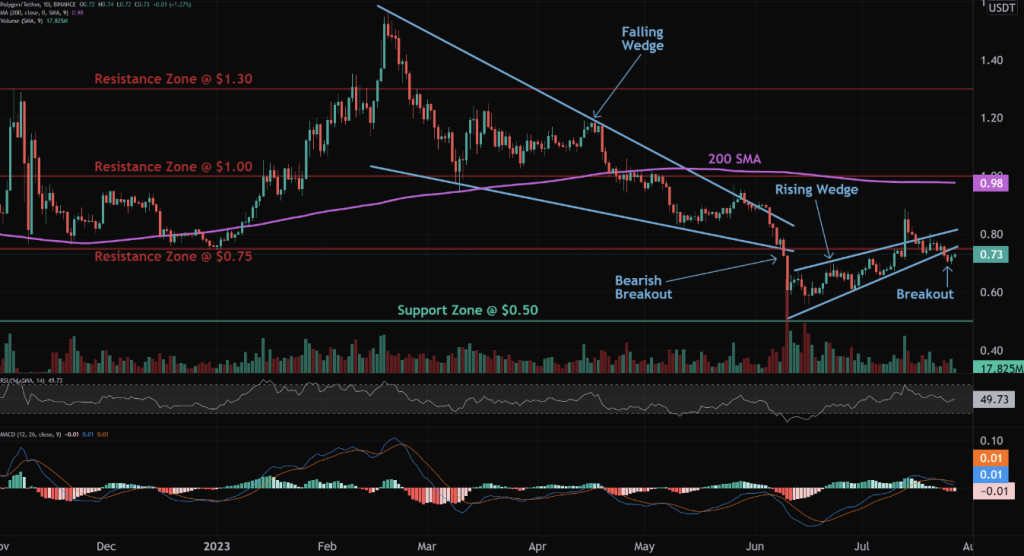
The current trading setup for Polygon (MATIC) is characterized by a bearish breakout from a Rising Wedge pattern. This pattern, which has formed below the key level of $0.75, confirms a potential downtrend. Traders are advised to set a price alert at this level to stay informed about any significant price movements.
The Rising Wedge pattern is a crucial element to consider. This pattern typically forms after an uptrend and is often an indicator of a potential bearish reversal in the original uptrend. When the price breaks the lower trend line, it is expected to trend lower, signaling a possible shift in market dynamics, altFINS reports.

It’s worth noting that emerging patterns, those that form before a breakout occurs, can be traded by swing traders between the convergence lines. However, the majority of traders prefer to wait for a completed pattern with a breakout, as it provides a more definitive signal.
In terms of trend, Polygon presents a neutral stance on a medium-term basis. However, on both short- and long-term bases, the trend leans towards a downtrend. This mixed trend scenario suggests a complex market situation that traders need to navigate carefully.
The momentum for Polygon is also mixed. The MACD Line is currently below the MACD Signal Line, which is a bearish sign. However, the RSI is approximately 50, indicating a neutral momentum. This combination of bearish and neutral signals adds another layer of complexity to the trading scenario.
Finally, the support and resistance levels provide key markers for traders. The nearest support zone for Polygon is at $0.50, providing a potential floor for the price. On the other hand, the nearest resistance zones are at $0.75 and $1.00. These levels could act as ceilings that the price might struggle to break through.
SHIB might face a period of volatility in August
On the other hand, Shiba Inu, the self-proclaimed “Dogecoin killer,” is gearing up for a period of volatility around August 6th, as per analyses on TradingView. This period coincides with the anticipated launch of Shibarium, a new development related to the coin, as reported by Finbold. The Shibarium launch is a significant event for the SHIB community and could potentially influence the coin’s price positively.
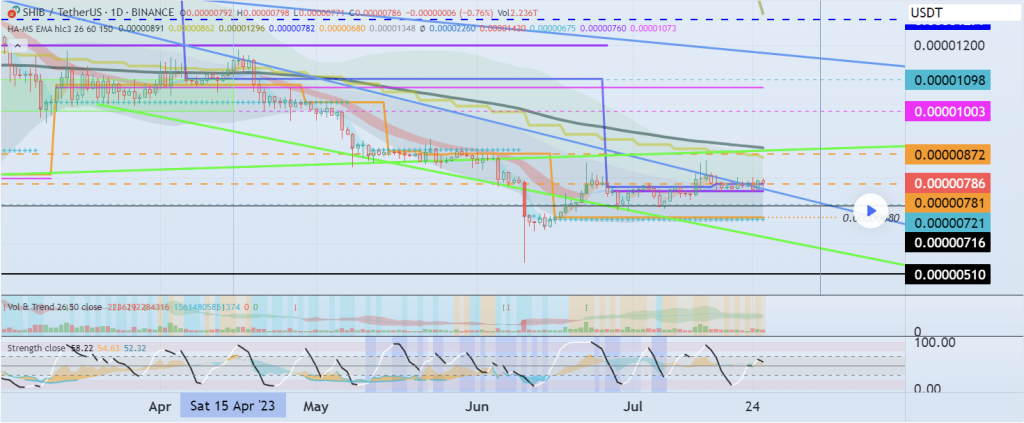
The SHIBUSDT pair is poised for a potentially significant move. The pair is currently treading a delicate line, with the key support zone lying between $0.00000781 and $0.00000872. If this support holds, a bullish scenario could unfold, propelling the pair towards the $0.00001279 mark, a level corresponding to the HA-High indicator on the weekly chart, read Crypto trader reports.

However, the markets are known for their unpredictability, and a bearish outcome is equally plausible. Should the pair break below the $0.00000781 support, it could descend towards the HA-Low indicator on the daily chart, making the $0.00000716 level a critical line of defense for the bulls.
The upcoming period around August 6th is marked as a potential phase of volatility. As always, it’s essential to approach these markets with a balanced perspective, acknowledging both the potential rewards and inherent risks. Remember, while technical analysis provides valuable insights, it does not guarantee profits, and each investor should consider their risk tolerance and investment strategy. Stay tuned for more updates as the situation unfolds.
However, it’s important to note that the analyses and the Shibarium launch suggest different price movements for SHIB. While the analyses indicate a period of volatility, the Shibarium launch could steer the price in a positive direction.
As always, in the ever-evolving crypto market, it’s crucial for investors to stay informed and make decisions based on a comprehensive understanding of the market trends and upcoming developments. The contrasting scenarios for MATIC and SHIB underscore the diverse opportunities and risks inherent in the crypto space.


