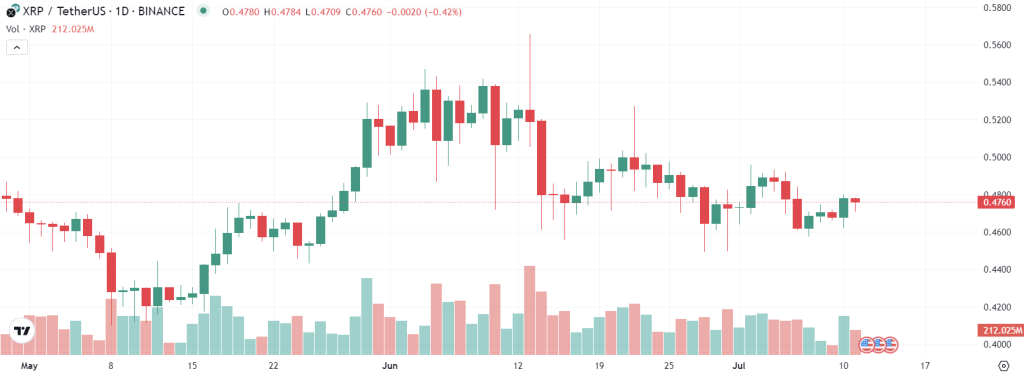
Ripple’s XRP has been displaying a unique pattern of movement. For nearly a month now, XRP, like its counterpart Bitcoin, has been moving within a defined range, exhibiting a slow-motion trend that has caught the attention of market watchers.
The technical analysis of XRP’s price movement suggests two probable scenarios explains one of the top crypto analysts on YouTube. The first one points towards a potential corrective move upwards. If this scenario plays out, the price could reach a resistance area between 50.7 and 54 cents. A break above this resistance would necessitate a re-evaluation of the current market dynamics.
Doge2014 raises 500K in days celebrating Dogecoin. Make potentially big profits and get in on exclusive airdrop!
Show more +However, it’s crucial to note that this is merely a possibility and not the primary expectation. The cryptocurrency market is known for its unpredictability, and XRP is no exception. Therefore, investors and traders should approach this scenario with caution.
The second scenario suggests a direct downward movement if the price breaks below the 45 cent level, which was the low made on June 30th. A break below this level would also mean breaking below the trend line, indicating a shift toward a downward trend. This scenario aligns with the short-term trend for XRP, which has been downward, with recent lower lows and lower highs.

Despite these predictions, it’s important to remember that the price of XRP has been moving within a range, making the wave count unreliable. This lack of a clear sense of direction makes it necessary for investors and traders to take it level by level.
While the short-term trend for XRP points towards a downward movement, the market’s volatility and the current range-bound movement of XRP make it essential for investors to stay vigilant and flexible. As always, in the world of cryptocurrencies, the only constant is change.
ChainLink (LINK) in the Bear’s Grip: A Rocky Ride or a Temporary Dip?
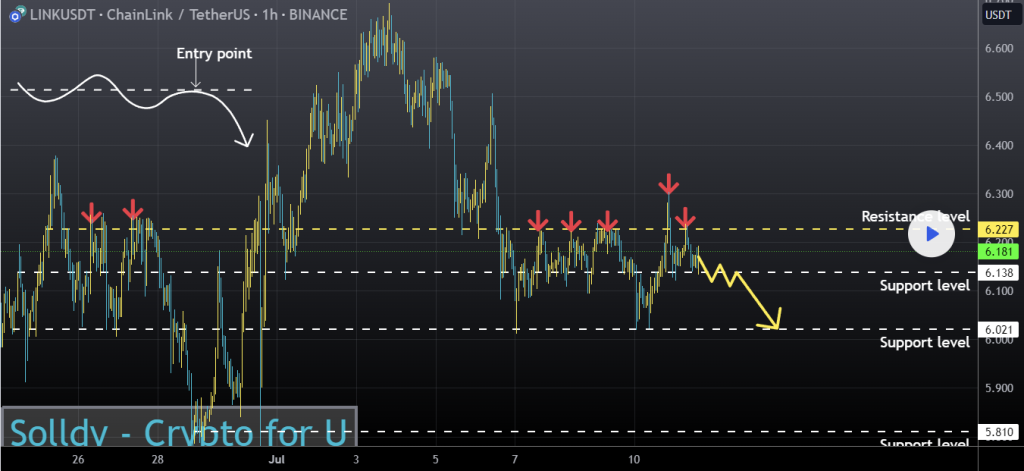
ChainLink (LINK) has been making waves, but not necessarily for the right reasons. The digital asset has been caught in the grip of the bears, as evidenced by its position below the 50 Exponential Moving Average (EMA) in the 4-hour time frame. This is a clear bearish signal, indicating that the asset may be in for a rough ride, as explained in the analysis recently posted on TradingView.
Adding to the bearish outlook, the Relative Strength Index (RSI), a key indicator of momentum, has plunged into the bearish zone in both the 4-hour and 30-minute time frames. This suggests that the downward pressure on the asset is mounting and that a further decline could be on the horizon.

The price of LINK has seen minor fluctuations in the past day, with a low of $6.14 and a high of $6.23, with a decrease of 0.56% in the last 24 hours. Despite the slight decrease, Chainlink remains a significant player in the cryptocurrency market, ranking 22nd in terms of market cap.
While the current outlook for LINK may seem grim, it’s important to remember that the cryptocurrency market is highly unpredictable. The bearish signals could be a precursor to a downward trend, but they could also be a temporary blip in an otherwise upward trajectory. As always, investors are advised to keep a close eye on the market and make informed decisions based on a combination of technical analysis and market trends.


