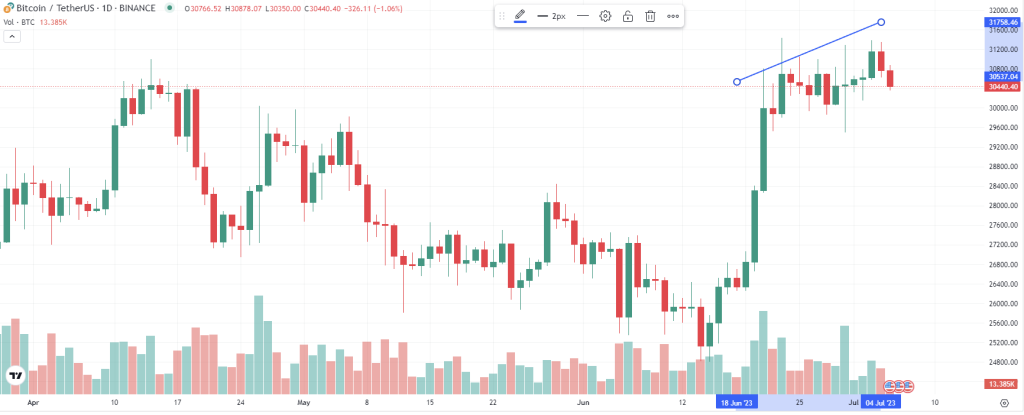
Despite a recent drop below $31,000, market analysts suggest that this is not necessarily a bearish sign, but rather a part of the larger wave pattern that Bitcoin is currently navigating. On June 21st, Bitcoin broke the $30k mark, and ever since, it’s been moving up to $31k.
Through the lens of the Elliott Wave Theory, a popular tool used by traders to analyze market cycles and forecast trends, Bitcoin appears to be in the third wave of a 1-2 setup that began in November. Within this third wave, another 1-2 setup has been identified, which concluded on June 15th. If these wave patterns hold true, Bitcoin could be poised for a significant upward rally, potentially reaching the heights of $43,000 to $44,000.

However, these predictions hinge on Bitcoin maintaining a crucial support level of $26,190. Should this support level fail to hold, it may indicate that the second wave did not finish on June 15th as initially thought, necessitating a reset of the second wave to a lower level.
Doge2014 raises 500K in days celebrating Dogecoin. Make potentially big profits and get in on exclusive airdrop!
Show more +Furthermore, there’s a possibility of Bitcoin producing one more high into the low $32,000 region. If this occurs, it would provide a clear five-wave structure, making the B wave less likely. However, if Bitcoin descends now without making one more high, the prospects of a high B wave remain in focus.
The upward movement of Bitcoin has shown impulsive characteristics, a common trait in markets that are trending. This impulsiveness, combined with the potential for one more high, suggests that Bitcoin could still have some room to grow.
Cardano (ADA) Price Forecast: Are we heading to a new low?
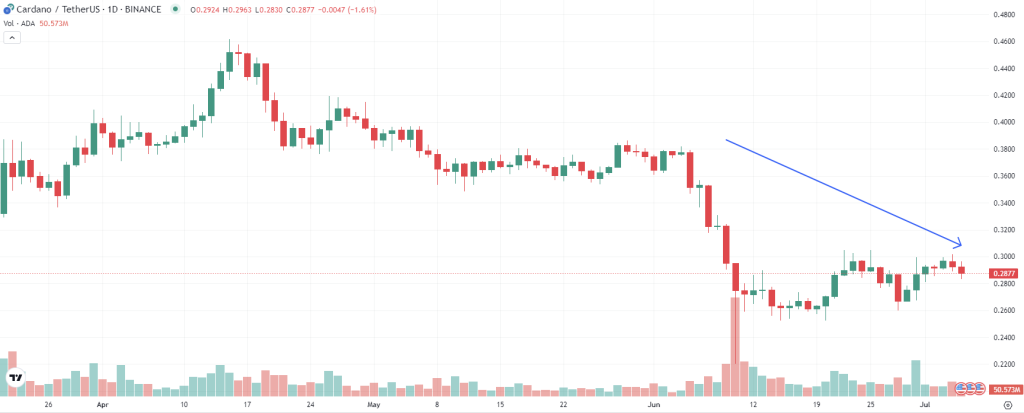
Cardano (ADA) has been making waves, and it’s time to delve into its recent price movements by analyzing the recent analysis from one of the top YouTube crypto analysts.
Cardano’s price has been dancing to the rhythm of the Elliott Wave theory, presenting two potential scenarios – a bullish and a bearish outlook. The bearish scenario, represented by the white wave count, suggests that ADA might be heading for another low, given the ongoing weakness of many altcoins. This scenario gains traction if the price breaks below the 23.8 cents mark, which is the 78.6% retracement level.

On the other hand, the bullish scenario, represented by the yellow wave count, suggests that ADA might have formed a wave one leading diagonally from the 10th of June low and a wave two pullback. This scenario gains momentum if the price holds the 23.8 cent level and rallies above the wave one high at 30.5 cents.
However, the market is a complex beast, and ADA has not yet provided sufficient evidence that the trend is indeed changing. The price movement from the 10th of June low can be counted as a three-wave structure, indicating a corrective wave rather than an impulsive wave which is needed for a bullish scenario.
If you are thinking about whether to hold or invest in ADA, here are some of the most recent factors you should consider:
- The popular trading app will no longer support the trading of Cardano, Solana, and Polygon after a certain date. This decision may have an impact on the availability and accessibility of Cardano for traders and investors.
- The Cardano Foundation launched its inaugural Annual Report [1]. This report provides an overview of the foundation’s activities and achievements during the specified period.
- Cardano (ADA) has seen a decline in its performance compared to the rest of the market [4]. This could be attributed to security concerns or other factors affecting the cryptocurrency market as a whole.
In conclusion, the market is teetering on the edge of these two scenarios. Until ADA breaks above 30.5 cents, the bullish scenario cannot be trusted, and investors should be prepared for potential new lows or at least a reset of Wave 2 in the orange support area. As always, it’s crucial to stay informed and make decisions based on careful analysis. Stay tuned for more updates on the ever-evolving cryptocurrency market.


