So we did it, we broke the $6850 and closed the daily just above those levels. Even though CNBC tried their best to jinx the move, the market bulls turned out too strong even for one of the most reliable counter-trade indicators out there. With CNBC getting the move right this time, there was no shortage of FUD from other mainstream news outlets. However none of this managed to hold BTC back (at least for now) and the move towards the lower ranges of $7k seems to be on the cards. We scouted out the sentiment among the traders and experienced crypto analysts:
Bitcoin (BTC)
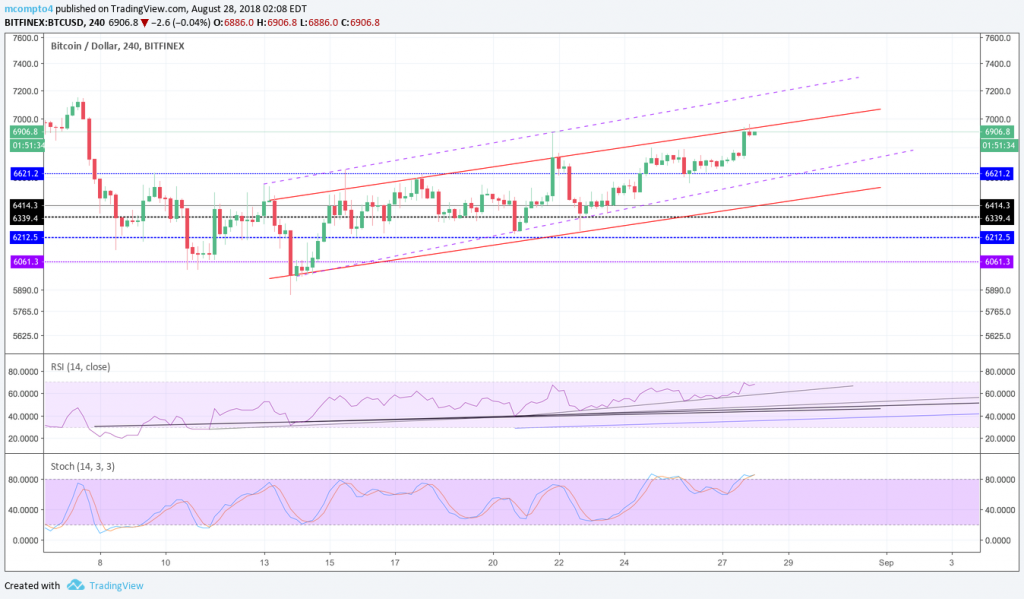
Trader mcompto4 noticed that while Bitcoin formed a 4h channel, there are reasons to stay cautious:

“BTC 1.44% appears to be staying within a 4h channel. It appears that we might be forming a bear flag on the weekly, and we need to continue to see diminishing volume if the pattern is to play out. The price action still looks weak because BTC 1.44% is slowly grinding upwards with a lack of impulsive behavior as it breaks resistances, accompanied by declining daily volume.”
In the same post, he noted several key resistances for the next move and spoke about the current support:
“Important resistances that could keep price contained within the channel or that bears could use as stop/loss levels are also just above recent price: monthly 12ema at 7200, weekly 12ema at 7000, weekly 55ema at 7140 and daily 50MA at 6950. We have finally made it above and are trying to hold 12/26/55Ema on the daily timeframe.“
Check out the complete analysis to learn what he thinks about trading in this pattern and where he spotted a rising wedge forming.
Turningmecard agrees with the rising wedge pattern and thinks the “moon” isn’t in just yet. He offers some insights of his own, adding that the wedge’s top sits somewhere around $7.1k so he feels this is a good place to secure your profits. Altcoin investors are mentioned in his analysis, as he expects a general market pullback in the upcoming days.
“Many beginner level investors think, this is the start of the bull run. NO! Guys, if you buy alts that fine, but this will be short lived so i assure you not to hold those alt coins so long! If you hold an alt coin, i do too, i bought TRON. I plan to sell them today or tomorrow, to see if this overcomes the 50MA daily. In theory, we are already pretty much at the top level, so it can drop heavy anytime. However, i do think, since 67/68 is a support now, it will try upper levels. So do not be greedy and sell them at 7.1k max. No need to risk more than that. If goes up, buy at pullbacks. Do not hold alts like it will go up forever!”
Check out this really extensive analysis of his as he speaks in detail about the monthly picture as well as price targets and dates of his (and perhaps your) future longs.
@HsakaTrades confirms that the market seems to be switching from “ranging” to “trending”, indicating that an upwards trend is starting to form:
It's important to note that since $BTC broke 6.8k, the markets have switched from ranging to trending (bullish).
Trending Markets: Strong impulse moves, consolidation, followed by another impulse in the original direction. Retraces are relatively smaller and short-lived. pic.twitter.com/0a1T8qKOTT
— Hsaka (@HsakaTrades) July 24, 2018
Ethereum (ETH)
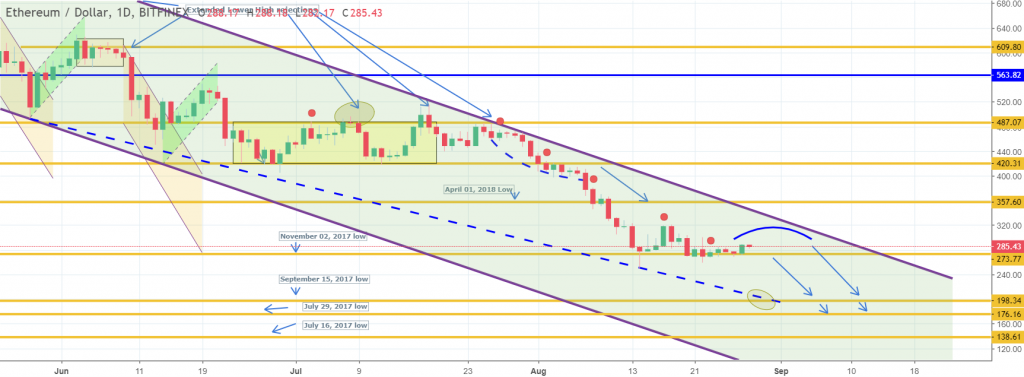
InvestingScope thinks Ethereum is currently stuck in a downwards channel that won’t be abandoned just yet:

“Ethereum is extending the consolidation phase on 4H ( MACD = 0.000) still within the 1D Channel Down ( RSI = 37.776, MACD = -30.520, B/BP = -11.8760). The 1D neutral CCI = 13.4232, Highs/Lows = 0.0000 and Ultimate Oscillator = 50.016 indicate that it is near pricing a Lower High. As seen on the chart, the blue curve will serve as the confining instrument.”
Their analysis gives you more details about the targets of their shorts so be sure to check that out here.
Ripple (XRP)
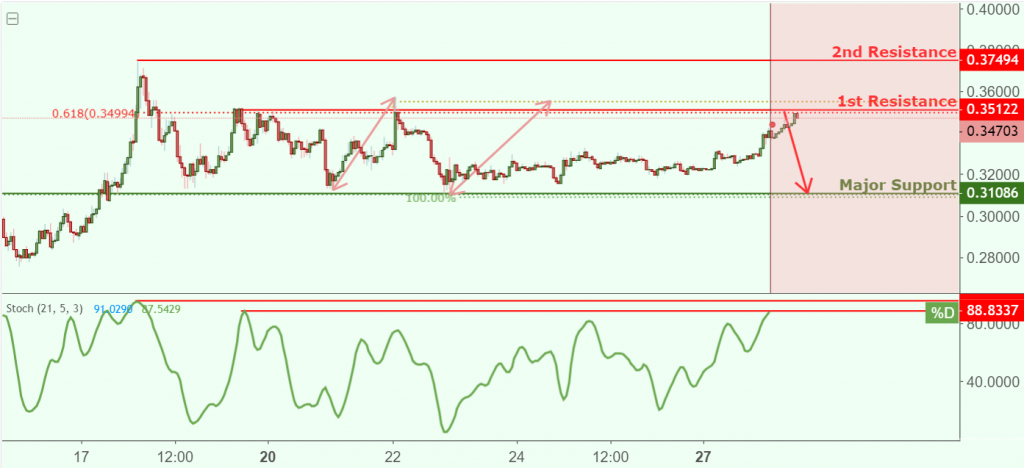
Trader easyMarkets thinks XRP is nearing a resistance and could be in for a short-term drop:

“XRPUSD is approaching our first resistance at 0.3512 (horizontal swing high resistance, 61.8% Fibonacci retracement, 100% Fibonacci extension) where a strong drop might occur below this level pushing price down to our major support at 0.3108 (horizontal swing low support, 100% Fibonacci extension, 50% Fibonacci retracement).”
They also mention that stochastic is nearing a resistance zone as well; read about that here.
Other thoughts
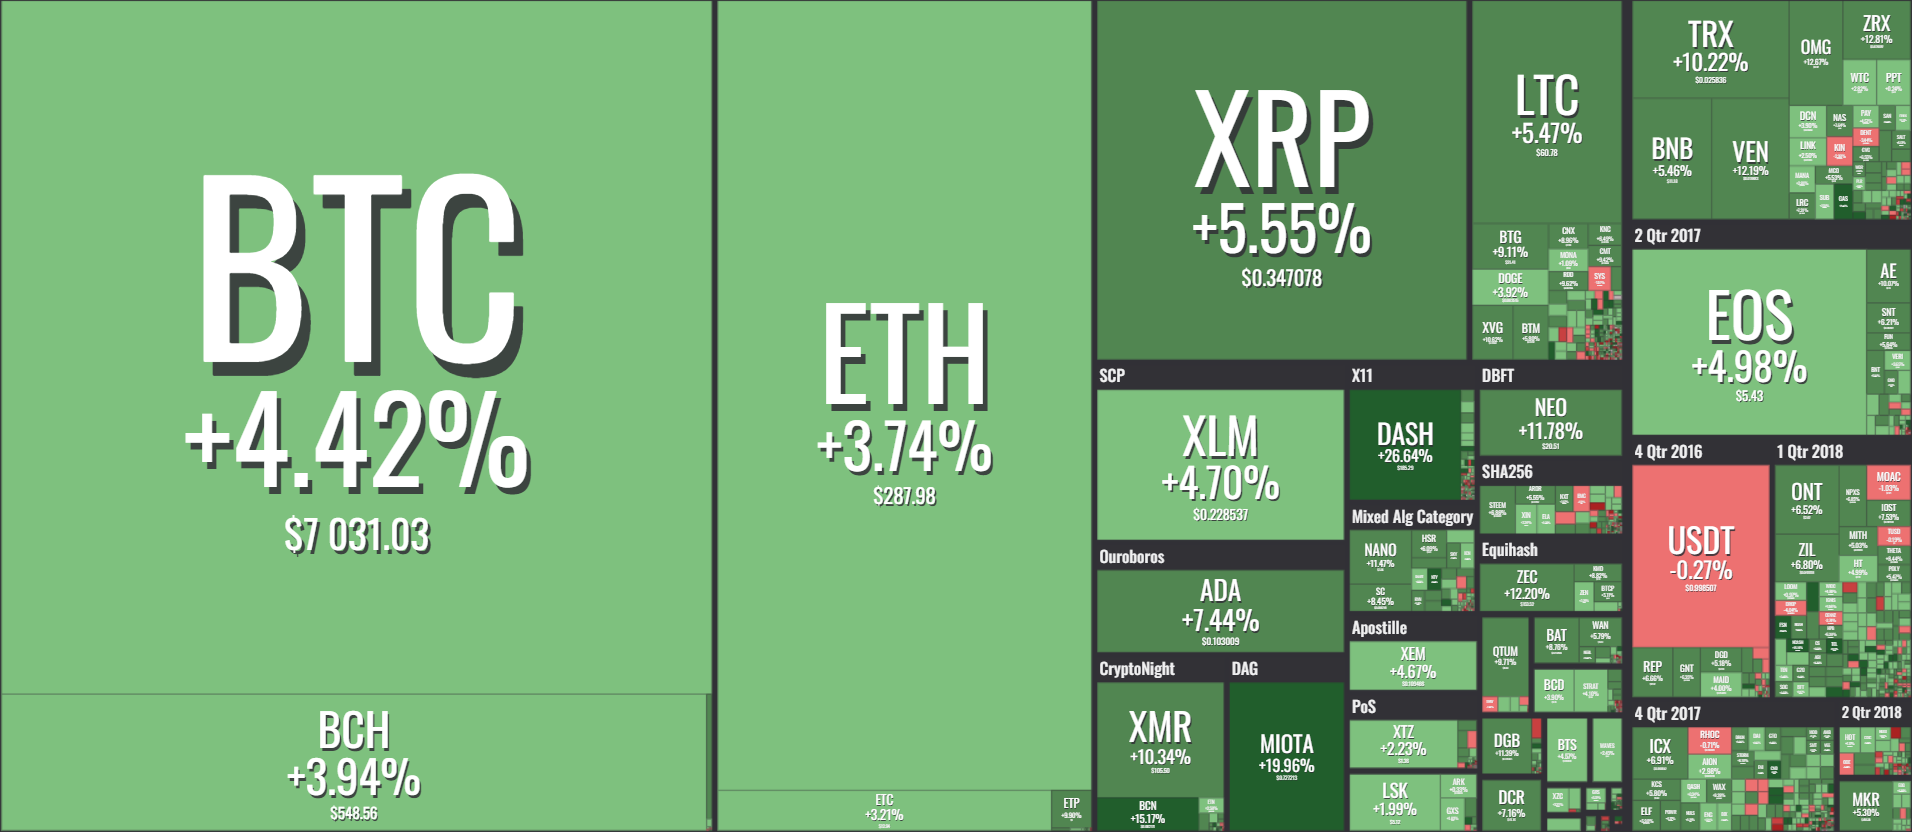
The latest Bitcoin move brought positive price action across the board. Quite a few alts (18 in total at the moment of writing) saw their prices rise over 10% in the last 24 hours, with Dash (27%) and Gas (22%) breaking above 20%. At the same time, only 6 altcoins were in the red, with Emercoin’s 2.60% drop making it the “biggest loser” of the day.
It has been a while since the market experienced a day like this one. With that in mind, it’s important to stay grounded and think clearly about what comes next. Imminently a pullback to levels of $6800 can be expected once this current move loses its strength; however there are clear signs that the trend is shifting, so much so that we could be looking for a move back to 5 figure BTC price. We will know more in a couple of days.


